TOC

Garbage collection

Adamansky Anton

Garbage collection

The problem

Errare humanum est

The GC Solution

Developer free from thinking too much... ☺

The GC Solution

The GC problems

GC in languages

Object graph

Tracing GC algorithms

Mark and sweep

  1. Traverse object graph from GC roots
  2. Mark each each reachable object (set a flag)
  3. Upon traversal remove all unmarked objects

Mark and sweep (MARK)

Mark and sweep (MARK)

Mark and sweep (MARK)

Mark and sweep (MARK)

Mark and sweep (MARK)

Mark and sweep (SWEEP)

Mark and sweep (SWEEP)

Simple mark and sweep drawbacks

Tri-color marking

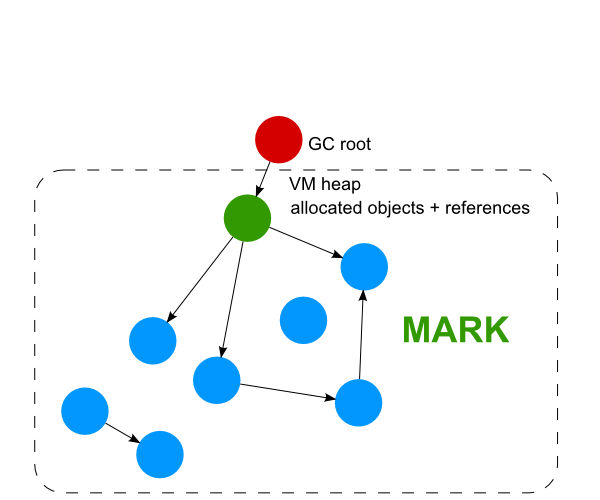
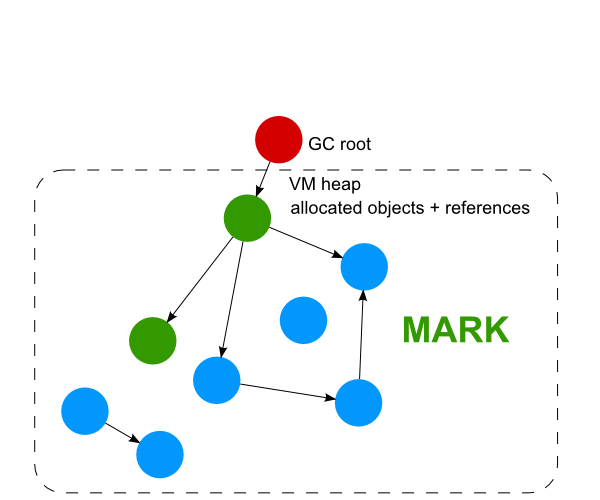
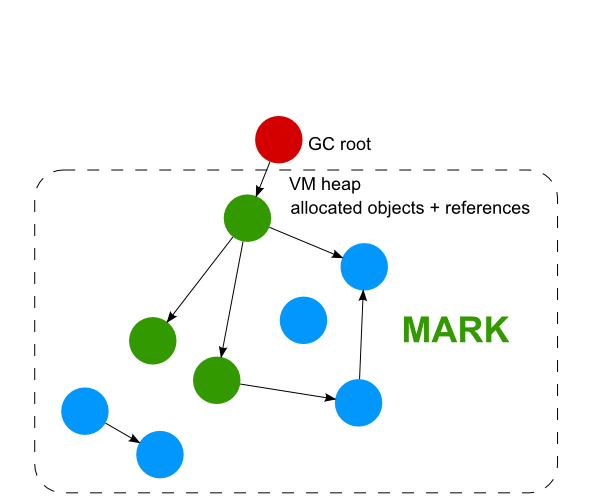
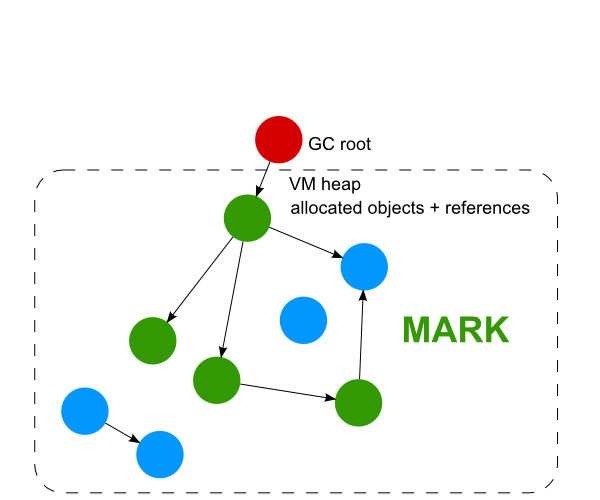
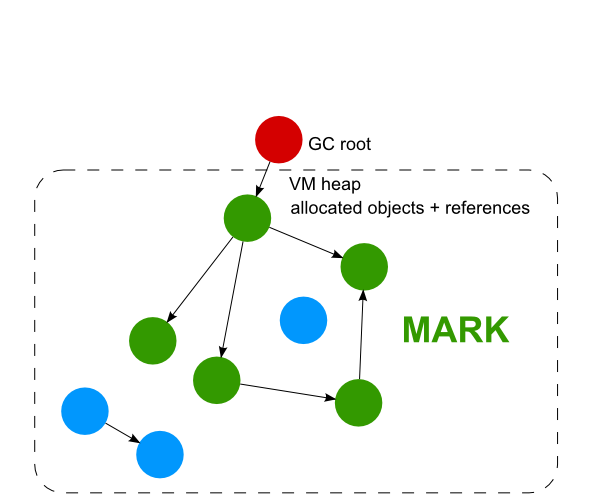
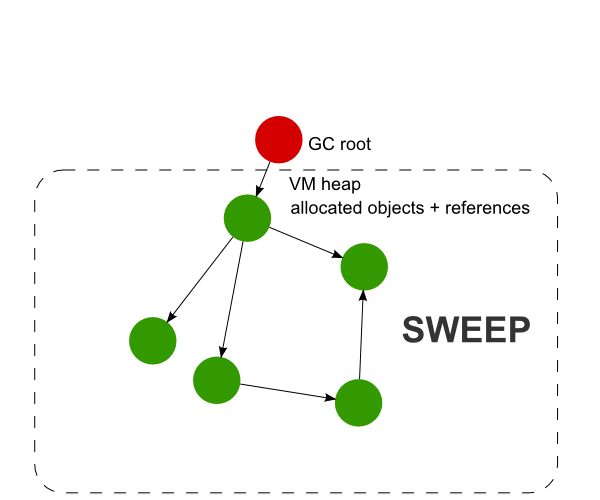
Maintain 3 objects sets.

  1. Initially all objects are white
  2. Grey all GC roots
  3. While gray set is not empty
    • If it has white child → color child grey
    • Otherwise color node black
    • Go to the step 3

Black nodes points only black or gray nodes.

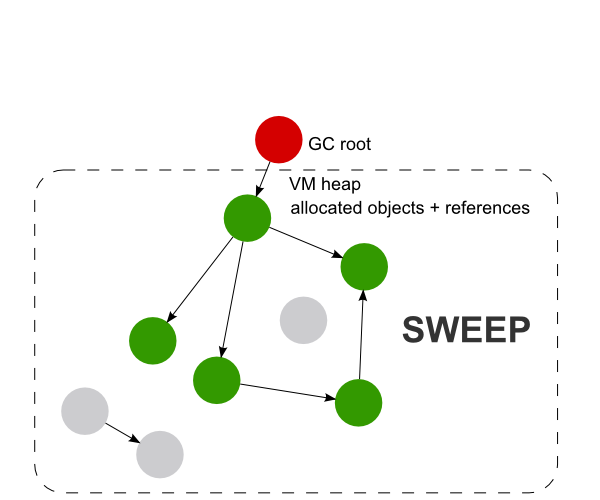
If gray set is empty — all nodes in white set can be garbaged.

Tri-color marking

As result you do not have perform full memory scan.
Look at the gray set size and if needed free all objects from white set.

Tri-color marking + Mark-and-sweep

Mark-and-sweep-compact (MSC)

Mark-and-sweep-compact (MSC)

pros: cons:

Concurrent mark-and-sweep (CMS)

TODO

Stop-and-copy GC

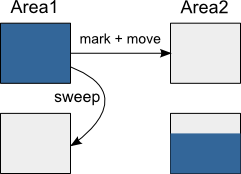
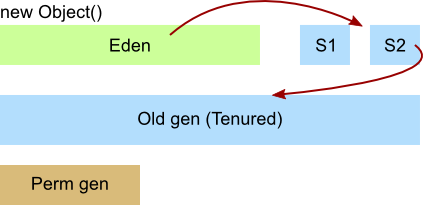
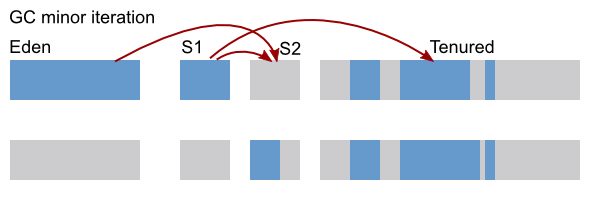
Two equal memory areas. Cheney's algorithm (1970).

  1. Mark
  2. Move live objects into free memory area
  3. Prune old area and make it free
  4. Now roles of Area1 ↔ Area2 flipped

Stop-and-copy GC explained

  1. Managed memory is divided into two equal spaces. One is labeled "from-space", the other "to-space".
  2. New objects are always allocated at one end of to-space.
  3. An incremental collecter traverses from-space, starting with a "root set" of known-live objects, and copies each object encountered into the other end of to-space. This collector replaces the object in from-space with a "forwarder" to the to-space object.
  4. An incremental "scanner" process scans the objects copied into to-space field by field, copying objects referenced by them from from-space to to-space. This scanner leaves behind a forwarder for each object that is copied. The scanner stops when it reaches the end of the objects that were copied into to-space by the incremental collector.

Stop-and-copy GC explained

  1. Any access to a forwarder is redirected to the to-space object referenced by the forwarded, and the original reference is fixed to reference the to-space object.
  2. When a reference to a from-space object is stored into a to-space object, the referenced object is copied to to-space and a forwarder left behind.
  3. At any time after the scanner has finished, a "flip" takes place, where the to-space and from-space pointers are reversed, the (new) to-space is cleared, and the root set is copied.

Stop-and-copy GC

pros: cons:

Generational GC

Some empirical observations:
Most of resently created objects have a short lifetime

            Integer c = 0;
            for (int i = 0; i < ...; ++i) {
                c  = new Integer(i + c);  //replace old c with new one
                ...
                if ((c % 100) == 0) break;
            }
            //We have a bunch of young short-lived `c` objects
        

Reference counting GC

Problems:

GC in JVM

All GC in JVM uses generational GC model.

Review in next slides the JVM memory model used for generational GC.

JVM memory model

Java memory model

  1. All new objects created in Eden space
  2. Eden objects survived in minor GC
    promoted into S1/S2 space.
  3. Survived objects from S1/S2
    promoted into Tenures space.
  4. From Java 8 Perm Generation has been replaced with Metaspace.

Three different types of GC

When Major or Full GC run all application threads are paused. It’s called as stop-the-world events. In Minor GCs also stop-the-world event occurs but momentarily.

Scavenge GC

Scavenge GC

How can we detect live Eden objects?

Full GC (Duty pages list)

Instead of scanning full old space for refs on Eden objects
  1. Cleanup duty-page list after each minor GC
  2. Track each refence change, e.g.: 
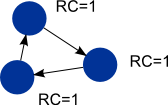
foo.bar = something;
  3. And mark modified by reference segment of memory(page) as duty(red).
  4. When minor GC started, inspect only duty pages for references into Eden.
  5. Peform GC and goto step 1.

GC in JVM

Serial GC

-XX:+UseSerialGC

Not used in production.

Parallel GC

-XX:+UseParallelGC

cons:

Parallel old GC

-XX:+UseParallelOldGC

Old is no the GC implementation age ☺

pros: cons:

Concurrent mark and sweep GC (CMS)

-XX:+UseConcMarkSweepGC

pros: cons:

Concurrent mark and sweep GC (CMS)

  1. Initial mark. Short STW to find GC roots
  2. Concurrent mark. Parallel tracing from GC roots (not in STW)
  3. Remark. Fix garbage produced by app during previous phase. (performed in STW)
  4. Concurent sweep (not in STW)

Concurrent mark and sweep GC (CMS)

G1 garbage collector

-XX:+UseG1GC

pros: cons:

Used as default GC in Java 9

GC tuning showcase

TestGCPause.java

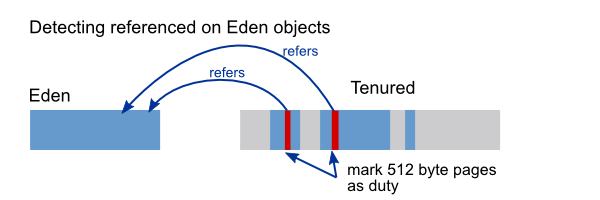
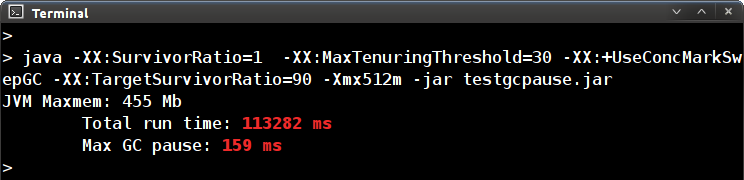
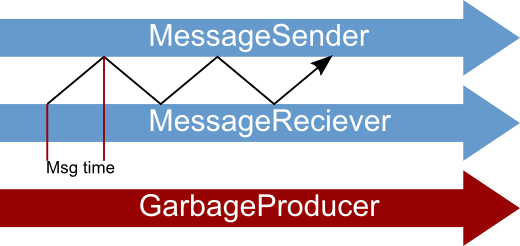
Measure the largest message delivering time ~ max GC pause

GC tuning showcase

GC tuning showcase

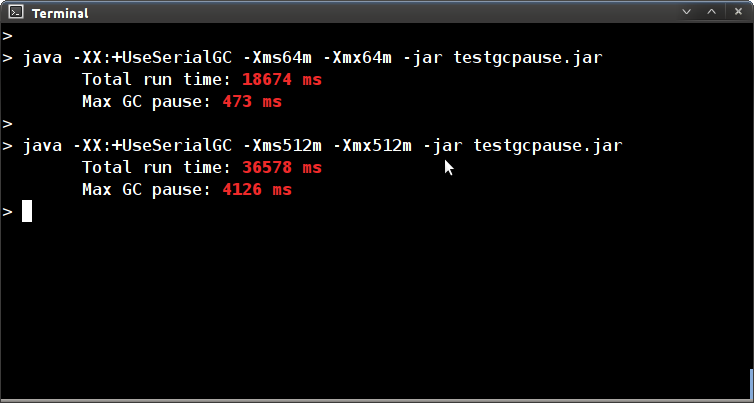
 - For small heap size ~64M  SerialGC is effective
 - STW time grows proportionally to the heap size.
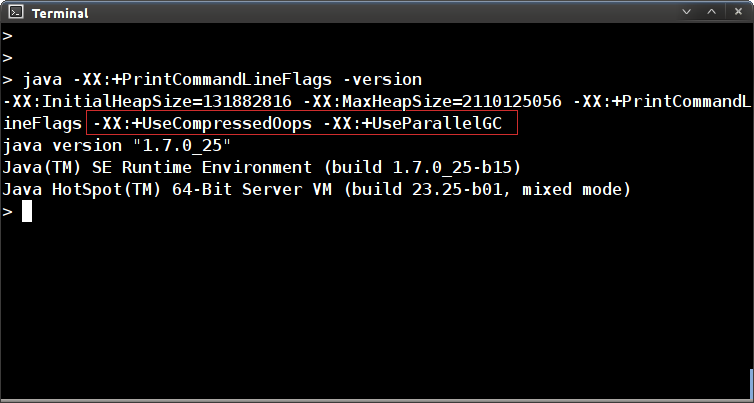
GC tuning showcase

Turning On GC debug

            -XX:+PrintGC
        
...
[GC 139776K->135432K(506816K), 0,9174710 secs]
[GC 275208K->263794K(506816K), 1,0039820 secs]
[Full GC 403570K->384989K(506816K), 2,0204030 secs]
...
        
[GC <allocatedMemoryBefore>-><allocatedMemoryAfter>(<heap size>), <time> secs]
[Full GC <allocatedMemoryBefore>-><allocatedMemoryAfter>(<heap size>), <time> secs]
        

Turning On GC debug (get more info)

            -XX:+PrintGC -XX:+PrintGCDetails
        
[GC [DefNew: 139776K->17472K(157248K), 0,8694740 secs]
            139776K->135432K(506816K), 0,8696040 secs]
            [Times: user=0,76 sys=0,11, real=0,87 secs]

[Full GC [Tenured: 349567K->253689K(349568K), 1,6324180 secs]
            506815K->253689K(506816K),
            [Perm : 2769K->2769K(21248K)], 1,6325410 secs]
            [Times: user=1,64 sys=0,00, real=1,63 secs]
        

GC tuning showcase

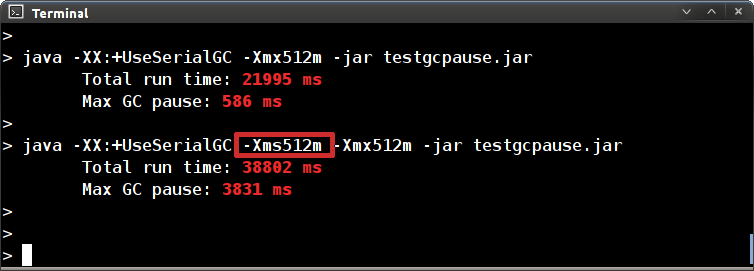
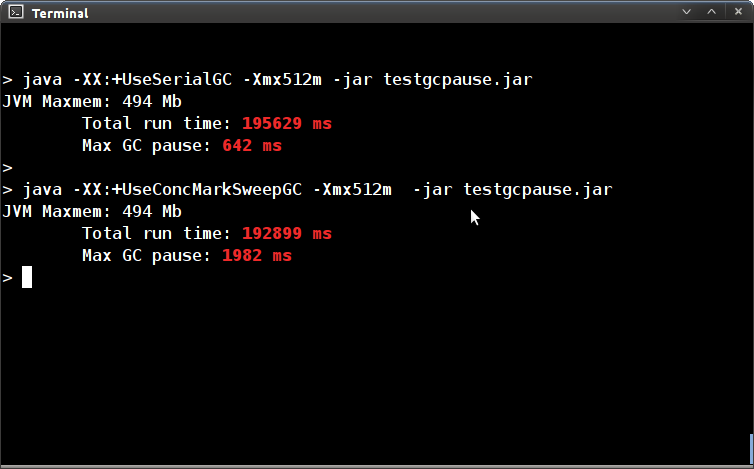
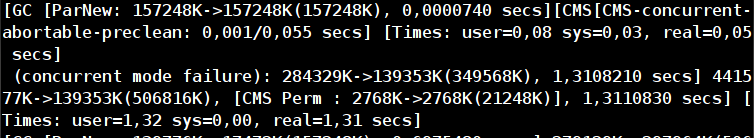
 - Turning -XX+UseConcMarkSweepGC cause poor results :(
 - Let's go to under the hood with -XX:+PrintGC -XX:+PrintGCDetails ...
        

-XX:+UseConcMarkSweepGC

The problem

Possible solutions

GC tuning is an experiment with many trials/failures

  1. Discover application specific characteristics which can affect on performance
  2. Remember the Pareto principle: 80% of application bottlechecks usually caused by 20% of code

Examine TestGCPause.java

  1. Very high ratio of short lived garbage objects produced by `GarbageProducer` thread.

GC tuning is an experiment with many trials/failures

  1. Turn GC logging on
  2. Change VM options (Use dichotomy here)
  3. Change application workload parameters
  4. Run application
  5. Evaluate results
  6. Inacceptable? Go to the steps 2 or 3

Our results TestGCPause.java

Resources

Resources